
Mission Control Dispatch | Published May 7, 2026
Cloud vs. local inference economics: Mac mini, DGX Spark, and BeastMode
We took the SemiAnalysis / Nebius GPU-cluster study you supplied, matched it against our own fleet benchmarks, and then rebuilt the answer around the boxes actually powering Yeti Claw today. The Mac mini comes out as the strongest small-surface economics play, DGX Spark becomes compelling when it stays busy, and the BeastMode lanes make the most sense as shared-capacity text workers rather than pretend GPU replacements.
24x7 fully loaded local cost using current-market Apple capital and California power.
24x7 fully loaded local cost using current NVIDIA price and a conservative 240W power envelope.
AWS vs. Nebius TCO in the study’s H200 inference-endpoint scenario.
Runpod Secure Cloud L4 starting rate used as the budget GPU baseline.
Executive read
What changed once we used our own fleet data
- The Mac mini is already cheaper than every cloud accelerator baseline in this report once it is amortized, even if we only count a normal workweek and use a conservative max-power assumption.
- DGX Spark is not the cheapest sticker-price answer, but it becomes rational quickly when its text and image workloads actually keep the box occupied.
- The BeastMode lanes are useful because they harvest spare ESXi capacity. Their economics are good only if we treat them as shared text workers, not premium real-time lanes.
- The SemiAnalysis / Nebius study’s core thesis holds: support, setup, storage, and utilization move the answer more than raw GPU-hour price alone.
Study context
Why the provided study still matters
The study you provided is useful because it refuses to stop at the headline GPU sticker price. In its inference-endpoint scenario, it concludes that the total cost lands at 1.00x for Nebius, 2.13x for AWS, and 1.04x for the silver-tier composite provider. The report argues that support, storage, setup, and the cost of operating the surrounding stack are what make inference economics widen out, not just the accelerator line item.
| Study scenario | Nebius | AWS | Silver-tier | Read |
|---|---|---|---|---|
| Large LLM pretrain | 1.00x | 1.09x | 1.08x | Support and setup already move the answer, even before cloud prices diverge. |
| Multimodal RL research | 1.00x | 1.43x | 1.08x | GPU price, storage, and ops overhead widen the spread fast. |
| Inference endpoints | 1.00x | 2.13x | 1.04x | The operating stack is what makes hyperscaler inference expensive in real terms. |
Cost curves
Local hourly cost vs. published cloud pricing
These local numbers include hardware amortization and electricity. The Mac mini uses Apple’s published maximum continuous power. Spark uses the full 240W external PSU as a deliberate upper-bound assumption, which means its true sustained local cost is often better than shown here.
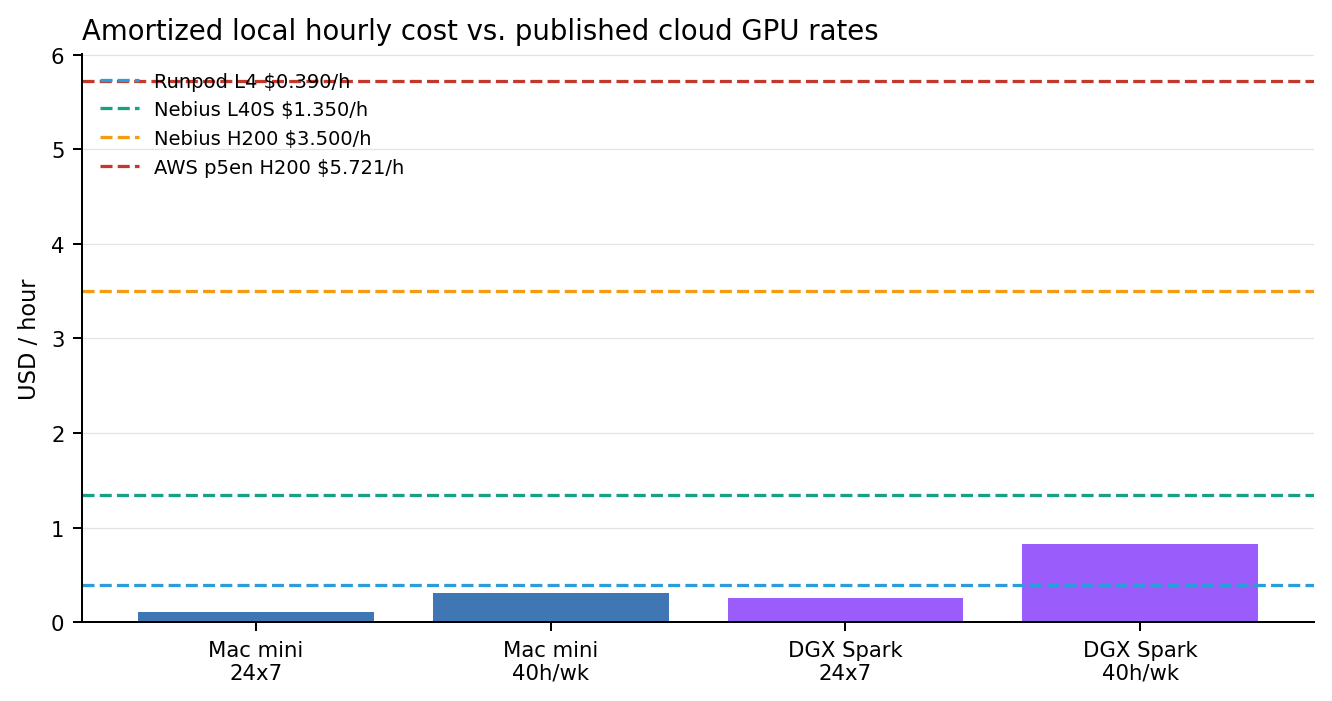
| Platform | Capital anchor | 24x7 local $/h | 40h/week local $/h | Role |
|---|---|---|---|---|
| Mac mini | $1,609 | $0.110 | $0.307 | Primary small-surface text lane |
| DGX Spark | $4,699 | $0.254 | $0.829 | Text + image development and inference box |
| Runpod L4 | n/a | $0.390 | $0.390 | Budget cloud GPU baseline |
| Nebius L40S | n/a | $1.350 | $1.350 | Enterprise mid-range GPU baseline |
| Nebius H200 | n/a | $3.500 | $3.500 | Premium inference GPU baseline |
| AWS p5en H200 | n/a | $5.721 | $5.721 | Hyperscaler premium GPU baseline |
Breakeven window
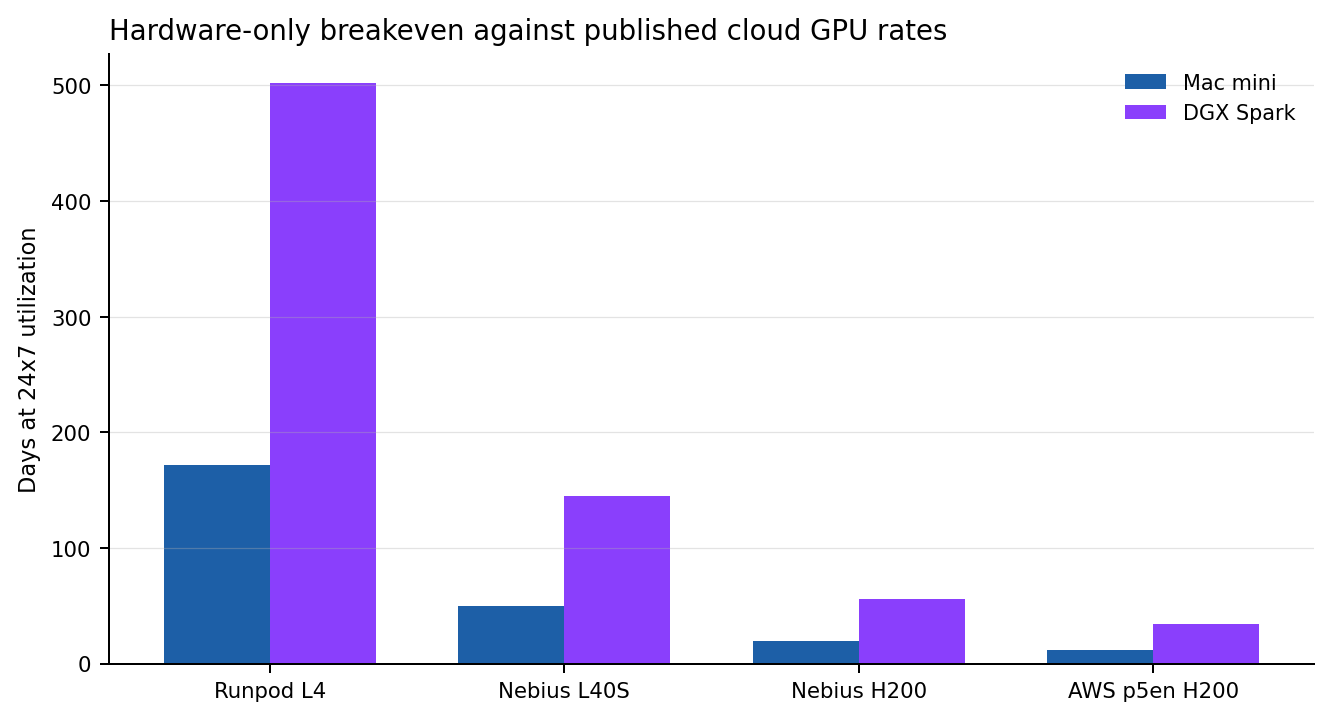
How long until the hardware pays for itself
This breakeven view uses the simplest clean formula: hardware price divided by published cloud hourly rate. It is not a full TCO replacement. It is the fastest way to answer the buy-vs-rent question before we add staff time, storage, or incident overhead.
| Platform | Runpod L4 | Nebius L40S | Nebius H200 | AWS p5en H200 |
|---|---|---|---|---|
| Mac mini | 4,125.6h / 171.9d | 1,191.9h / 49.7d | 459.7h / 19.2d | 281.2h / 11.7d |
| DGX Spark | 12,048.7h / 502.0d | 3,480.7h / 145.0d | 1,342.6h / 55.9d | 821.4h / 34.2d |
Token view
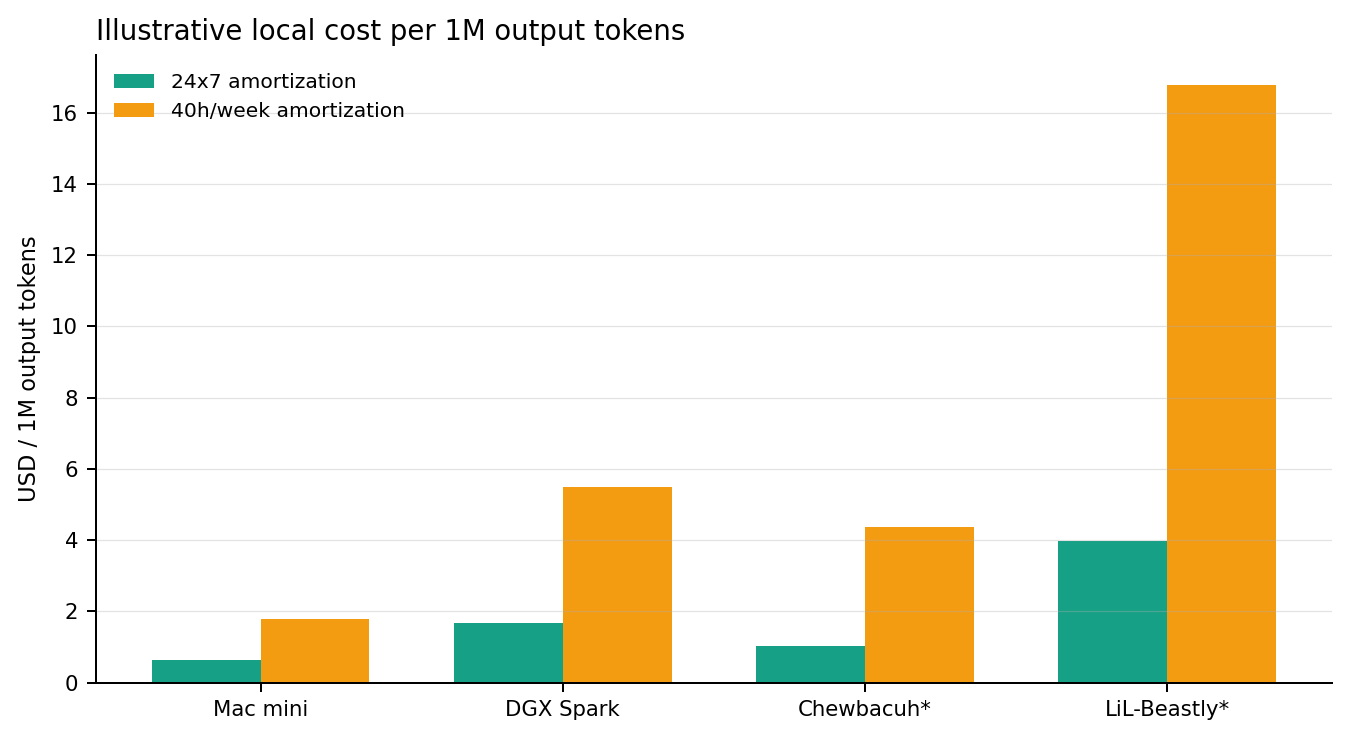
What the local fleet actually buys you per output token
We sampled representative local text requests and converted them into output-token throughput. This is a better normalization than requests alone because these boxes are serving very different models. For BeastMode, the numbers are explicitly labeled as lower-bound because ESXi does not expose clean per-host watt telemetry through the management path used here.
| Lane | Representative model | Output tok/s | 24x7 $/1M tok | 40h/week $/1M tok | Read |
|---|---|---|---|---|---|
| Mac mini | qwen2.5:7b | 47.77 | $0.64 | $1.78 | Best small-box economics in the fleet. |
| DGX Spark | qwen3:8b | 41.97 | $1.68 | $5.48 | Best when text and image duty cycles both keep the box active. |
| Chewbacuh* | qwen3:8b | 3.32 | $1.04 | $4.37 | Lower-bound capital-only estimate on shared infrastructure. |
| LiL-Beastly* | qwen3:14b | 1.78 | $3.98 | $16.78 | Better for larger-model availability than for cheap real-time output. |
BeastMode appendix
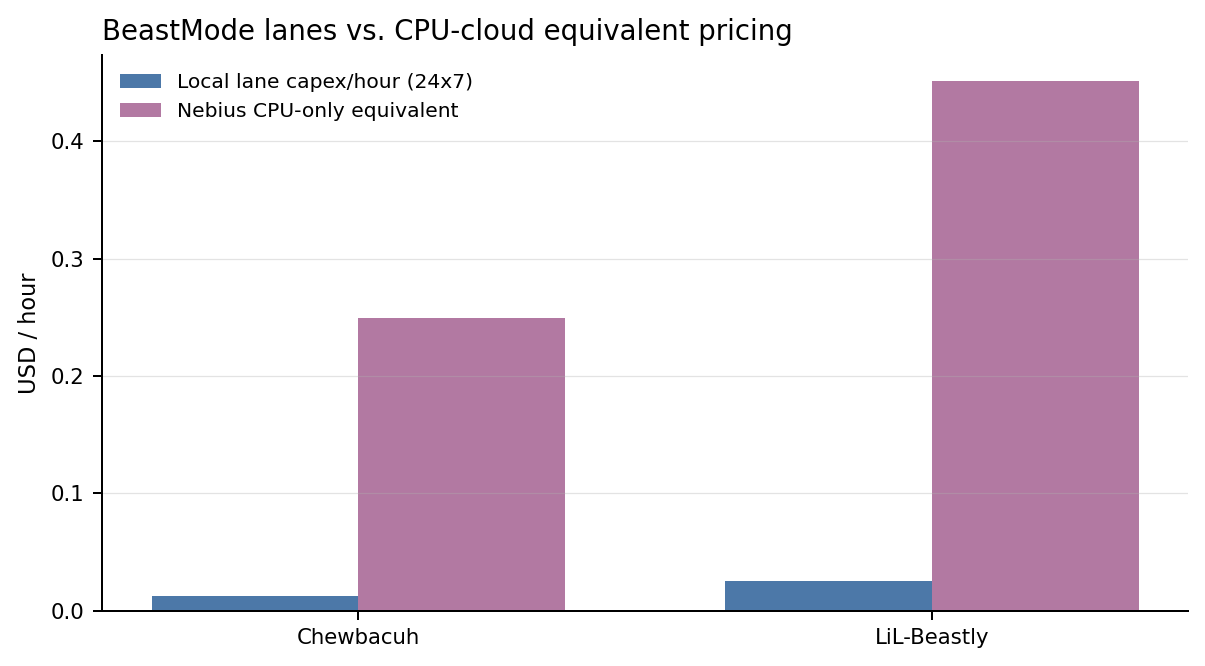
How the CPU-only lanes compare to CPU cloud
The right cloud comparison for BeastMode is not an H200. It is a CPU-only instance with similar vCPU and RAM. We used Nebius non-GPU AMD EPYC pricing as the baseline and priced each lane by its resource footprint.
| Lane | VM shape | Shared-host capital share | CPU-cloud equivalent | Breakeven |
|---|---|---|---|---|
| Chewbacuh | 8 vCPU / 48 GiB | $326 | $0.250/h | 1,304.8h / 54.4d |
| LiL-Beastly | 12 vCPU / 96 GiB | $670 | $0.451/h | 1,484.6h / 61.9d |