
Mission Control Dispatch | Published May 7, 2026
Mac Mini vs DGX Spark: text concurrency capacity review
We ran a controlled simultaneous-conversation benchmark across the Mac mini text stack and the DGX Spark text stack to find where each unit stays interactive, where it starts queueing, and where the operator should stop pretending throughput is still improving.
Four simultaneous mixed-model conversations validated with no thermal warnings.
Two simultaneous conversations stay in the premium responsiveness zone.
Eight mixed-model conversations completed without request failures.
Thermals stayed controlled even when the box was visibly queueing.
Executive read
What we learned
- The Mac mini passed every controlled step from 1 to 4 concurrent mixed-model conversations with zero request failures and no thermal or performance warnings.
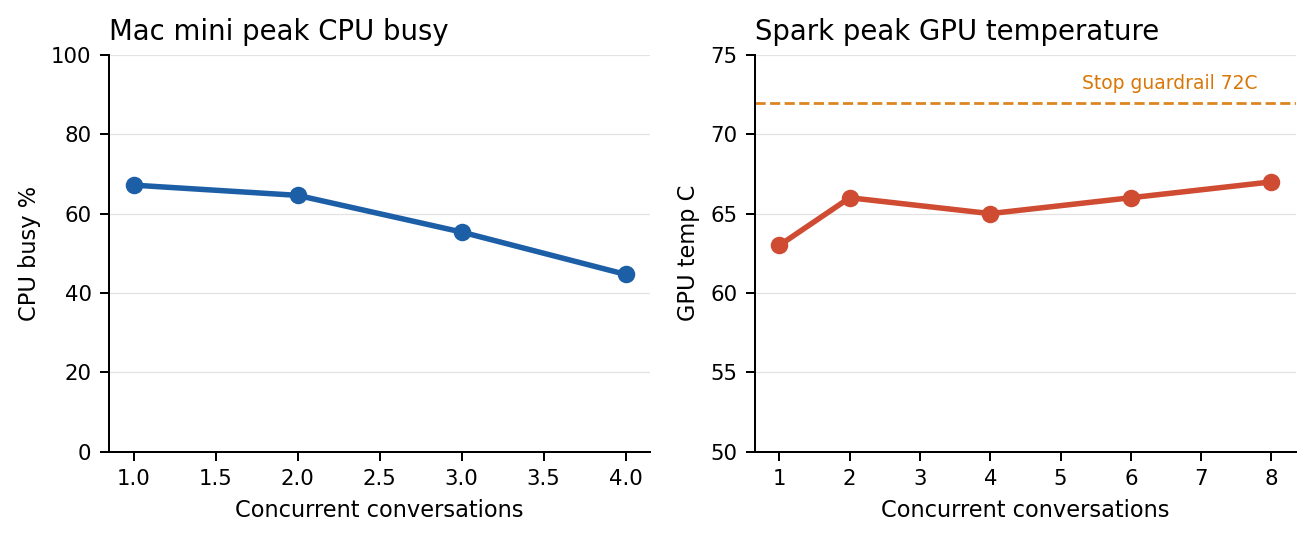
- The DGX Spark passed every controlled step from 1 to 8 concurrent mixed-model conversations with zero request failures, a 67C peak GPU temperature, and no transport loss.
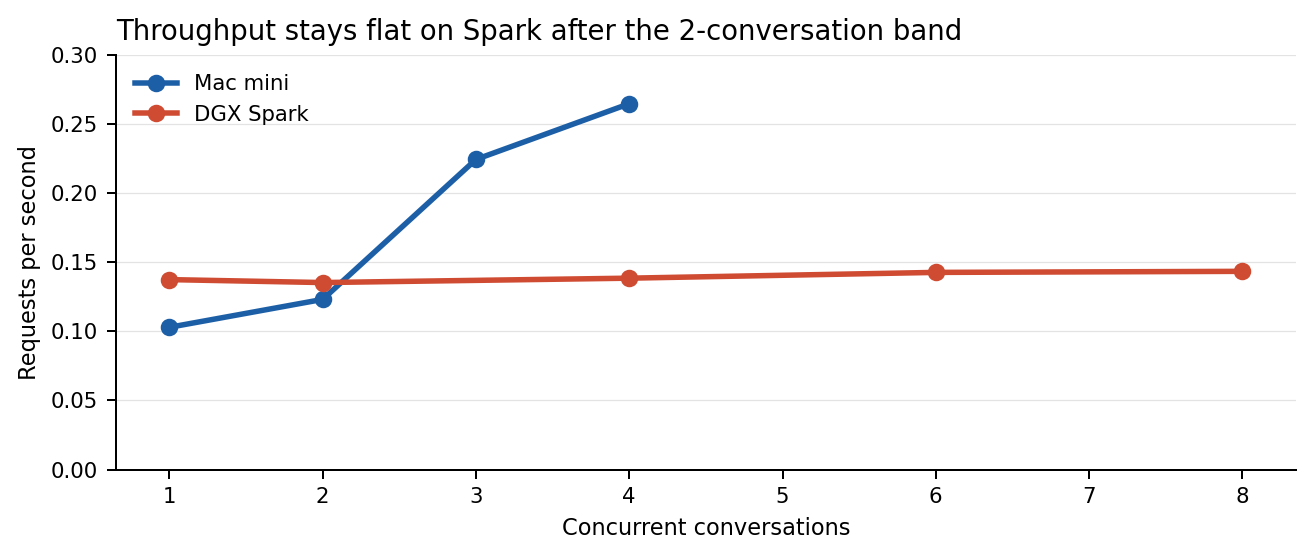
- DGX Spark did not fail under load, but it stopped getting meaningfully faster after the 2-conversation band. After that point, extra concurrency mostly turned into waiting time.
- The Mac mini result is conservative because Low Power Mode was enabled during the run. Its actual ceiling is likely higher than the validated band published here.
Systems under test
Benchmark envelope and guardrails
| Unit | Hardware and mode | Models under test | Safety control |
|---|---|---|---|
| Mac mini | Apple M4 Pro, 12 CPU cores, 48 GB RAM, Low Power Mode enabled | qwen2.5:7b, qwen3:30b, nemotron-3-nano:30b | Controlled cap at 4 concurrent conversations to preserve access during the run |
| DGX Spark | NVIDIA DGX Spark, ARM 20-core CPU, about 122 GiB system memory | llava:latest, nemotron-mini:latest, nemotron:latest, qwen3:8b | Automatic stop if any request failed or GPU temperature reached 72C |
Curve read
Throughput, latency, and thermals
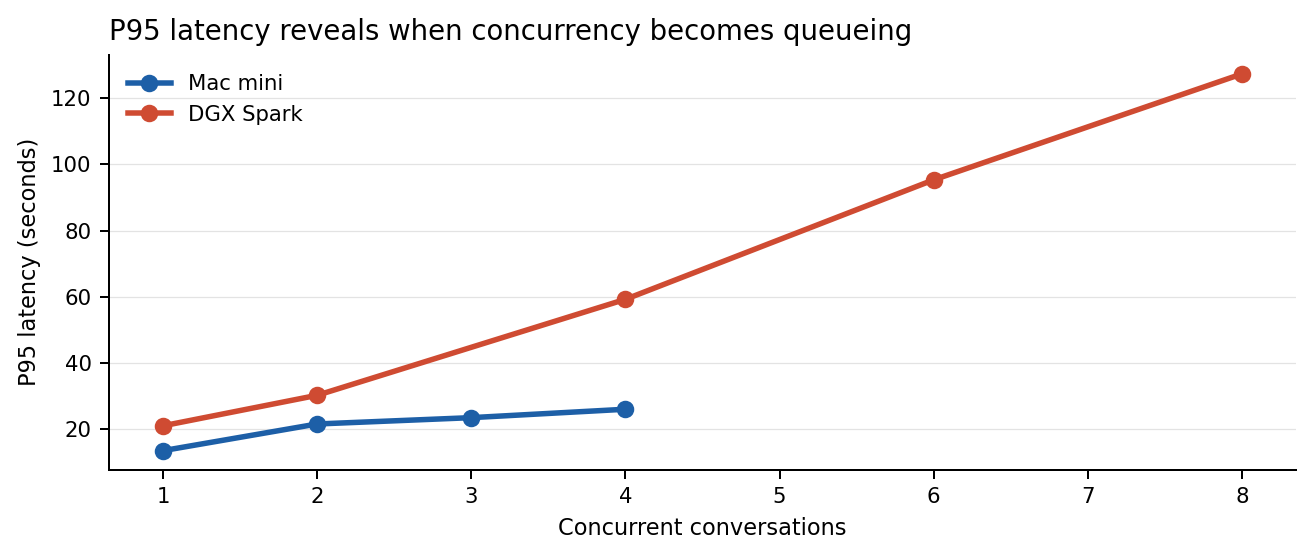
Spark’s signature was queueing saturation rather than instability. Throughput stayed almost flat from 0.137 requests per second at one concurrent conversation to 0.143 at eight, while P95 latency rose from 21.07 seconds to 127.35 seconds. The Mac mini, by contrast, kept improving throughput throughout the tested band and never triggered a thermal warning.
Comparative table
Headline operating bands
| Unit | Tested range | Hard failures | Recommended operating band | Peak environment |
|---|---|---|---|---|
| Mac mini | 1-4 concurrent conversations | 0 | 4 live mixed-model conversations validated today | No thermal warning; 67.18% peak CPU busy |
| DGX Spark | 1-8 concurrent conversations | 0 | 2 premium / 4 acceptable / 6-8 queued | 67C peak GPU temp; 96% peak GPU utilization |
Mac mini step table
Validated Mac mini results
| Concurrency | Success | Throughput rps | Avg latency s | P50 s | P95 s | Max s | Peak CPU % | Load1 | Thermal warn |
|---|---|---|---|---|---|---|---|---|---|
| 1 | 9/9 | 0.103 | 9.72 | 10.07 | 13.57 | 14.10 | 67.18 | 7.07 | No |
| 2 | 9/9 | 0.123 | 14.90 | 13.75 | 21.62 | 21.79 | 64.60 | 6.68 | No |
| 3 | 12/12 | 0.224 | 11.22 | 10.99 | 23.54 | 25.67 | 55.35 | 7.28 | No |
| 4 | 16/16 | 0.265 | 13.39 | 14.30 | 26.08 | 28.60 | 44.67 | 5.91 | No |
DGX Spark step table
Validated Spark results
| Concurrency | Success | Throughput rps | Avg latency s | P50 s | P95 s | Max s | Peak GPU C | Peak GPU % | Peak GPU W |
|---|---|---|---|---|---|---|---|---|---|
| 1 | 12/12 | 0.137 | 7.28 | 2.79 | 21.07 | 21.08 | 63.0 | 96.0 | 49.61 |
| 2 | 12/12 | 0.135 | 13.33 | 9.19 | 30.28 | 31.57 | 66.0 | 96.0 | 46.61 |
| 4 | 16/16 | 0.138 | 22.31 | 11.79 | 59.27 | 62.25 | 65.0 | 96.0 | 48.01 |
| 6 | 24/24 | 0.143 | 29.83 | 15.22 | 95.35 | 100.92 | 66.0 | 96.0 | 47.52 |
| 8 | 32/32 | 0.143 | 38.15 | 17.78 | 127.35 | 134.58 | 67.0 | 96.0 | 47.16 |